
ENERGY SCENARIOS ARE PLAUSIBLE AND CHALLENGING ALTERNATIVE FUTURES THAT CAN PROVIDE “STRATEGIC FORESIGHT” REGARDING CHOICES RELATED TO ENERGY.
Pennsylvania first began planning for a changing energy system in 2017 during the initial Pennsylvania Energy Horizons work. A group of Pennsylvanians representing a wide-ranging set of backgrounds and expertise convened to debate, and ultimately attempt to answer, the question of how Pennsylvania’s energy system might evolve in 25 years and what the implications might be for Pennsylvanians. This work used a world-renowned energy scenarios methodology. The project produced two different scenarios – Rivers and Roots – which highlighted a range of drivers and uncertainties that take Pennsylvania’s energy future along divergent paths. The two scenarios were neither “good” nor “bad” - they simply represented how different decisions could impact the long-term evolution of Pennsylvania’s energy system.
The scenario planning methodology traces its origins to the military strategist Herman Kahn and his work at the RAND Corporation. This methodology has since been used in military, business and academic organizations globally to think about their long-term planning in a manner that is systemic and able to more readily adapt to unforeseen changes. And while there are various examples of how scenario planning has been applied to energy systems, this is the first time that a U.S. state has undertaken such an endeavor. Royal Dutch Shell’s Global Scenarios Team provided the facilitation for this process – they have been developing energy scenarios for almost 50 years. Their expertise in using scenario methodology enabled our participants to grapple with tough energy and environmental issues as we developed the stories of two alternative energy futures for Pennsylvania.
Ultimately, our goal with employing scenarios methodology was not only to anticipate what could happen with Pennsylvania’s energy future, but to begin a meaningful dialogue among policy-makers, business executives, community leaders and politicians to thoughtfully and proactively help shape that future. In the end, it will be up to individual Pennsylvanians to read these stories, to draw their own conclusions about the ideal facets of our shared future; and then to act, and encourage society’s leaders to act, in a manner that helps shape our future.
To learn more about scenario planning for energy systems, visit these links:
Pennsylvania Energy MOdel
The Pennsylvania Energy Model (PEM) that accompanies the Rivers and Roots scenarios is a way of quantifying the various combinations of inputs and outcomes, which enabled us to put numbers to our long-term stories of Pennsylvania’s energy system.
The PEM is based on an energy model developed by the Boston Consulting Group and includes data from the U.S. Energy Information Administration and Oxford Economics. The model employs a combination of sector demand (the demand for energy within the state’s residential, commercial, industrial, and transportation sectors) and power supply data (the amount of power being generated and the resources used). Further, the model simulates the impacts on baseline sector demand and power supply to project the changes that could occur in Pennsylvania’s energy system based on the drivers exhibited in each scenario. For example, a change in the number of households will directly affect the demand for energy in and beyond the residential sector. Additionally, changing market dynamics and technological advances could also lead to changes in how the state generates electricity. The PEM reflects how these drivers could impact, for example, the amount of power that is generated by a given resource.
See below an example of how the PEM depicts the commonwealth’s energy mix (Figure 1) and sector demand (Figure 2) for “Rivers” and “Roots.” Notice that although the energy consumption totals are the same in each set, Figure 1 details which energy sources are being consumed while Figure 2 breaks down energy consumption by sector. Click on the images below to enlarge.
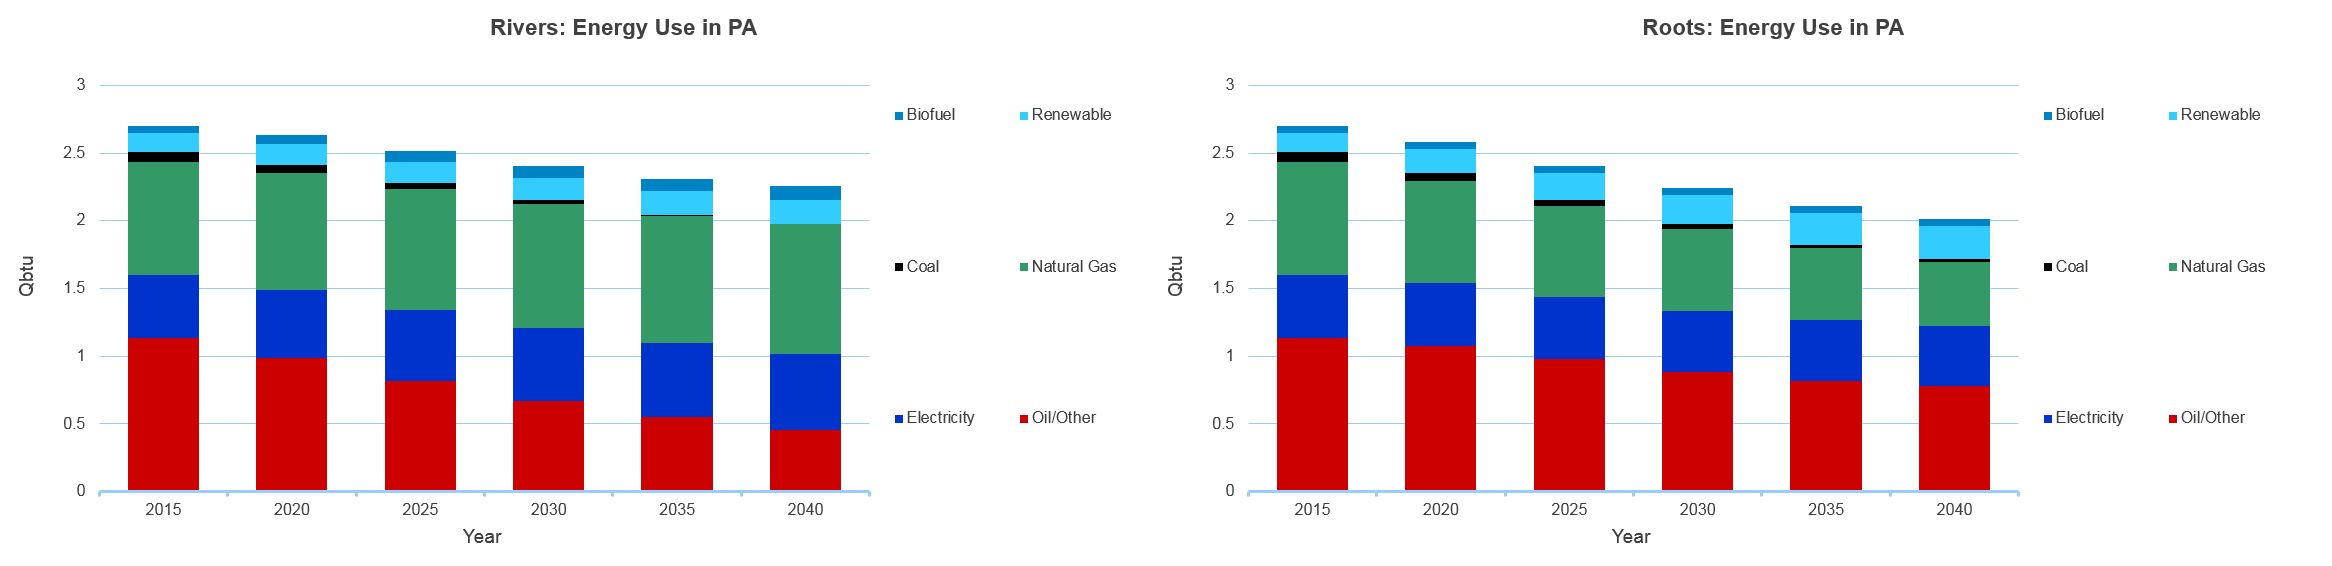
Figure 1
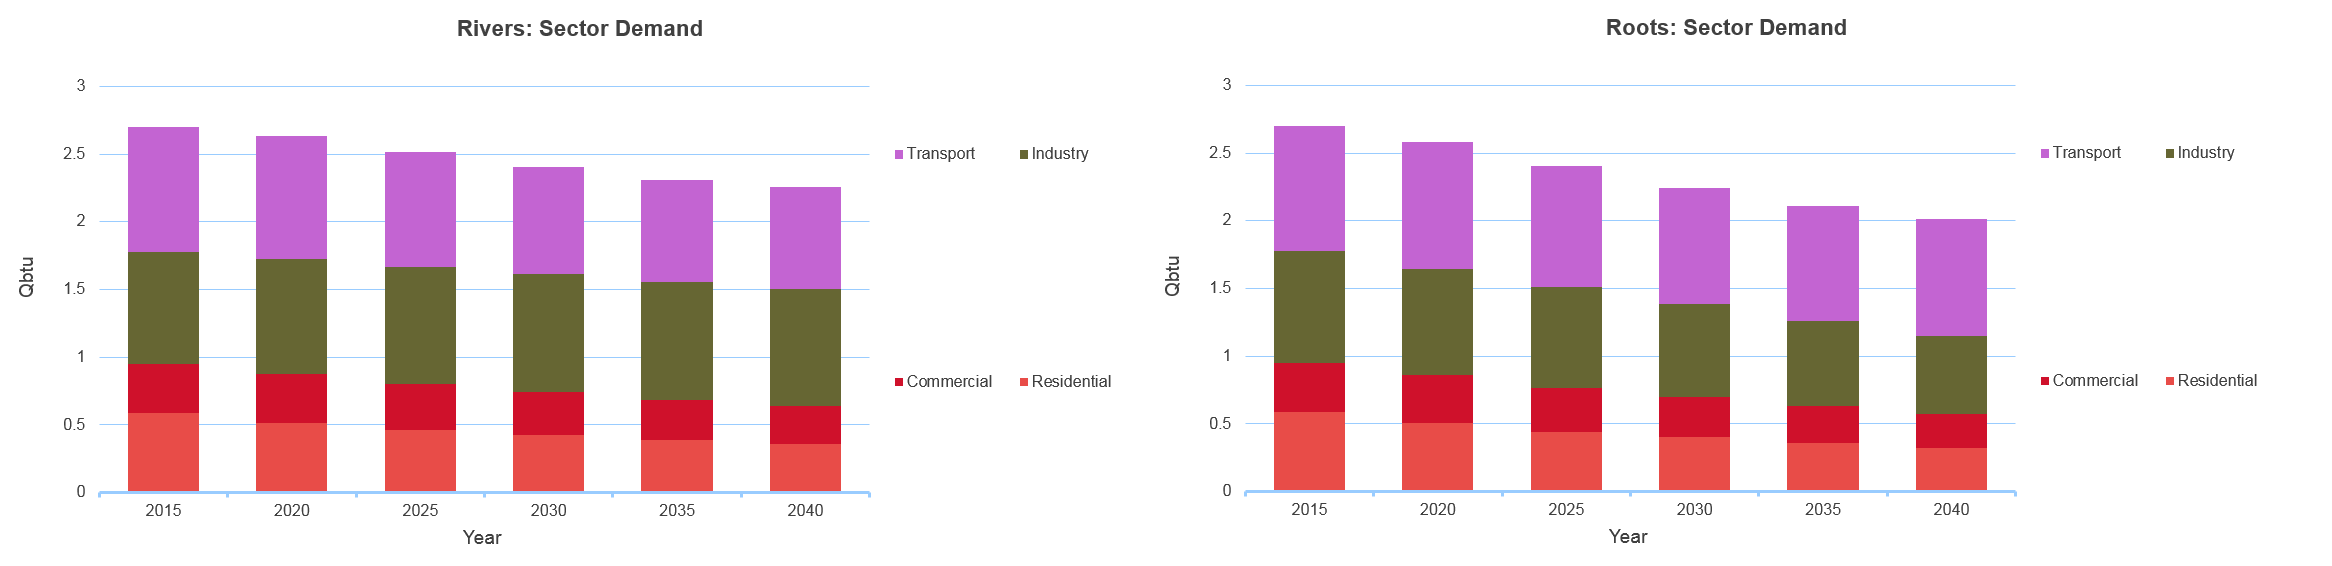
Figure 2